
Reports and analysis · Guide 4 of 28
Calculating OEE totals - General example
Worked example of how Availability, Performance, Quality and OEE are calculated per station, per station group, per department and for the whole company, and why the total OEE can be lower than individual values.
On this page
- OEE values calculated by stations
- Availability
- Performance
- Quality
- OEE
- OEE values calculated by station groups
- Example for Group 6
- OEE values calculated by departments
- OEE values calculated for the whole company
- Why is the total OEE lower than the individual OEE values?
- How to detect this?
- Where can I adjust the speed settings?
- A simplified example of how such total OEE value can occur and is calculated
OEE values calculated by stations
As this is the base for all the next calculations, we first break it down on a station level.
Availability
| Station name | Good production | Speed loss | Production time | Planned Time | Availability |
|---|---|---|---|---|---|
| Line A | 1303697 | 96439 | 1400136 | 1584254 | 88.38% |
| Line B | 1350052 | 90773 | 1461912 | 1728000 | 84.60% |
| Line C | 459990 | 86884 | 546874 | 623970 | 87.64% |
| Line D | 1350052 | 90733 | 1440825 | 1843200 | 78.17% |
| Line E | 680803 | 120517 | 801320 | 917991 | 87.29% |
| Line F | 893506 | 174142 | 1067648 | 1680471 | 63.53% |
| Line G | 278304 | 57147 | 335451 | 624505 | 53.72% |
| Line H | 447802 | 213366 | 661168 | 1193091 | 55.41% |
| Line I | 91682 | 11874 | 103556 | 405158 | 25.56% |
| Total | 6901117 | 917776 | 7818890 | 10600640 | 73.76% |
Performance
| Station name | Produced qty | Ideal produced qty | Performance |
|---|---|---|---|
| Line A | 3268496.4 | 3542344.08 | 92.27% |
| Line B | 3911907 | 4086207.76 | 95.73% |
| Line C | 1678000 | 1822913.33 | 92.05% |
| Line D | 2197145 | 2213895.83 | 99.24% |
| Line E | 2180700 | 2558881.85 | 85.22% |
| Line F | 2215470 | 2689550.56 | 82.37% |
| Line G | 1372000 | 1582210.54 | 86.71% |
| Line H | 3080175 | 4595117.6 | 67.03% |
| Line I | 222510 | 239259.66 | 93.00% |
| Total | 20126403.4 | 23330381.21 | 86.27% |
Quality
| Station name | Good quantity | Scrap | Total qty | Quality |
|---|---|---|---|---|
| Line A | 3268496.4 | 0 | 3268496.4 | 100% |
| Line B | 3911907 | 0 | 3911907 | 100% |
| Line C | 1678000 | 0 | 1678000 | 100% |
| Line D | 2197145 | 0 | 2197145 | 100% |
| Line E | 2180700 | 0 | 2180700 | 100% |
| Line F | 2215470 | 0 | 2215470 | 100% |
| Line G | 1372000 | 0 | 1372000 | 100% |
| Line H | 3080175 | 0 | 3080175 | 100% |
| Line I | 222510 | 0 | 222510 | 100% |
| Total | 20126403.4 | 0 | 20126403.4 | 100% |
OEE
| Station name | Availability | Performance | Scrap | OEE |
|---|---|---|---|---|
| Line A | 88.38% | 92.27% | 0 | 81.55% |
| Line B | 84.60% | 95.73% | 0 | 80.99% |
| Line C | 87.64% | 92.05% | 0 | 80.68% |
| Line D | 78.17% | 99.24% | 0 | 77.58% |
| Line E | 87.29% | 85.22% | 0 | 74.39% |
| Line F | 63.53% | 82.37% | 0 | 52.33% |
| Line G | 53.71% | 86.71% | 0 | 46.58% |
| Line H | 55.42% | 67.03% | 0 | 37.15% |
| Line I | 25.56% | 93.00% | 0 | 23.77% |
| Total | 73.76% | 86.27% | 0 | 63.63% |
OEE values calculated by station groups
For station groups we sum up all the same values and use same formulas.
| Station name | Good production | Speed loss | Production time | Planned Time | Availability | Produced qty | ideal produced qty |
|---|---|---|---|---|---|---|---|
| Line D | 1350052 | 90773 | 1440825 | 1843200 | 78.17% | 2197145 | 2213895.83 |
| Group 1 | 1350052 | 90773 | 1440825 | 1843200 | 78.17% | 2197145 | 2213895.83 |
| Line F | 893506 | 174142 | 1067648 | 1680471 | 63.53% | 2215470 | 2689550.56 |
| Line I | 91682 | 11874 | 103556 | 405158 | 25.56% | 222510 | 239259.66 |
| Group 2 | 985188 | 186016 | 1171204 | 2085629 | 56.16% | 2437980 | 2928810.22 |
| Line A | 1303697 | 96439 | 1400136 | 1584254 | 88.38% | 3268496.4 | 3542344.08 |
| Group 3 | 1303697 | 96439 | 1400136 | 1584254 | 88.38% | 3268496.4 | 3542344.08 |
| Line C | 459990 | 86884 | 546874 | 623970 | 87.64% | 1678000 | 1822913.33 |
| Line E | 680803 | 120517 | 801320 | 917991 | 87.29% | 2180700 | 2558881.85 |
| Group 4 | 1140793 | 207401 | 1348194 | 1541961 | 87.43% | 3858700 | 4381795.18 |
| Line B | 1395281 | 66634 | 1461915 | 1728000 | 84.60% | 3911907 | 4086207.76 |
| Group 5 | 1395281 | 66634 | 1461915 | 1728000 | 84.60% | 3911907 | 4086207.76 |
| Line G | 278304 | 57147 | 335451 | 624505 | 53.71% | 1372000 | 1582210.54 |
| Line H | 447802 | 213366 | 661168 | 1193091 | 55.42% | 3080175 | 4595117.6 |
| Group 6 | 726106 | 270513 | 996619 | 1817596 | 54.83% | 4452175 | 6177328.14 |
| Total | 6901117 | 917776 | 7818893 | 10600640 | 73.76% | 20126403.4 | 23330381.21 |
Example for Group 6
OEE values calculated by departments
As for station groups, it would be the same, summing up values in a department
| Station name | Good production | Speed loss | Production time | Planned Time | Availability | Produced qty | ideal produced qty |
|---|---|---|---|---|---|---|---|
| Line D | 1350052 | 90773 | 1440825 | 1843200 | 78.17% | 2197145 | 2213895.83 |
| Line F | 893506 | 174142 | 1067648 | 1680471 | 63.53% | 2215470 | 2689550.56 |
| Line I | 91682 | 11874 | 103556 | 405158 | 25.56% | 222510 | 239259.66 |
| Department 1 | 2335240 | 276789 | 2612029 | 3928829 | 66.48% | 4635125 | 5142706.05 |
| Line A | 1303697 | 96439 | 1400136 | 1584254 | 88.38% | 3268496.4 | 3542344.08 |
| Line C | 459990 | 86884 | 546874 | 623970 | 87.64% | 1678000 | 1822913.33 |
| Line E | 680803 | 120517 | 801320 | 917991 | 87.29% | 2180700 | 2558881.85 |
| Department 2 | 2444490 | 303840 | 2748330 | 3126215 | 87.91% | 7127196.4 | 7924139.26 |
| Line B | 1395281 | 66634 | 1461915 | 1728000 | 84.60% | 3911907 | 4086207.76 |
| Line G | 278304 | 57147 | 335451 | 624505 | 53.71% | 1372000 | 1582210.54 |
| Line H | 447802 | 213366 | 661168 | 1193091 | 55.42% | 3080175 | 4595117.6 |
| Department 3 | 2121387 | 337147 | 2458534 | 3545596 | 69.34% | 8364082 | 10263535.9 |
| Company total | 6901117 | 917776 | 7818893 | 10600640 | 73.76% | 20126403.4 | 23330381.21 |
OEE values calculated for the whole company
We take the sum of all stations and sum it up. The values are seen in each table above.
Why is the total OEE lower than the individual OEE values?
This comes from incorrect speed settings for products - one or more product has the actual production speed that exceeds the set ideal speed and causes performance value to go over 100%.
How to detect this?
- Shift View:
- OEE and speed widgets.
- Hourly produced quantity vs target (based on the ideal speed).
- Reports:
- Quantity report (ideal qty vs total qty), OEE report (performance value).
- Factory Overview:
- Performance indicator from the filter options.
- Dashboard:
- Different widgets allow tracking quantities (against a target) and also performance.
According to OEE theory, this can not happen. This means that the product speed settings for any station (called "routes" in Evocon) need to be checked and corrected. If performance is up to 100% and not over, then the total OEE would also fall somewhere between the individual values.
Where can I adjust the speed settings?
- Under product details in Settings, more information here.
A simplified example of how such total OEE value can occur and is calculated
-
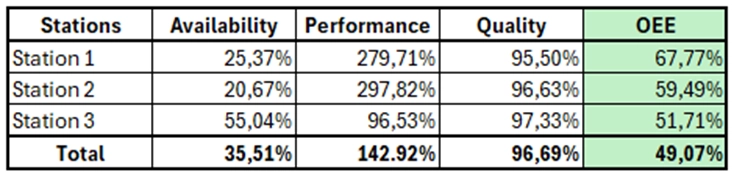
Let's say these are OEE report results for 3 stations over 6 months:
-
We can see that the total OEE is lower than any of the individual OEE value for this period.
-
If we calculate each station separately, we get the results as above:
- Station 1
- Availability 25,37%
- Performance 279,71%
- Quality 95,50%
- OEE = Availability × Performance × Quality = 67,77%
- Station 2
- Availability 20,67%
- Performance 297,82%
- Quality 96,63%
- Station 1